Data visualization communicates the relationships of data through graphs, charts, and other visual mediums. It’s the difference between hundreds of rows on a spreadsheet and a concise graph with a key and color coating. Being an ever-increasing driving force behind business decisions, it’s important that data is accessible and understandable to people who might not be familiar with it. Enter data visualization books.
Good data visualization helps you identify problem areas in a conversion funnel, predict future sales volume, determine product placement, and much more. Putting it into a visual format allows you to assess trends and patterns that would be hard to spot otherwise. Additionally, it gives you a reason to care about those trends and patterns once they are no longer random words and numbers. Sometimes it’s hard to grasp the impact of a dataset until it’s clearly laid out. Our minds often need context to create meaning.
Think of how frustrating it is to try and comprehend the size of the solar system. It’s a mind-boggling 1.87 light years away. But what does that even mean? If that same information were presented on a visual chart showing the size of the solar system in relation to Earth, you suddenly have a more profound understanding of how vast the solar system really is. Check out this “tediously accurate scale model of the solar system” for a truly incredible example!
Here, we’ve collected a list of five data visualization books to help you create visualizations that are meaningful, understandable, and still beautiful.
(Note: As with many disciplines in technology, there is a glaring lack of gender and racial diversity both in who gets hired into the field and in who gets to write about it. To take a peek into some of the data behind why diversity in tech is such a pressing issue, check out this article by Wired.)
 Fundamentals of Data Visualization by Claus O. Wilke
Great for beginners and highly recommended for professionals, Fundamentals of Data Visualization is an approachable way to grasp a comprehensive understanding of effectively showcasing data. Using examples of good and bad visualization, Wilke explores concepts such as how color can highlight or distinguish a value and how to use redundant coding to ensure you provide key information in multiple ways. By the time the reader reaches the end of the book, they will have built up an intuition for what makes good data visualization.
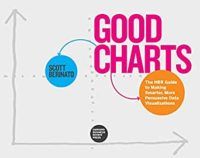
 Good Charts: The HBR Guide to Making Smarter, More Persuasive Data Visualizations by Scott Berinato
Good Charts is a guide to how data visualization works and how to use it in a way that will impress and persuade. Through his process of talking, sketching, and prototyping, Berinato teaches the reader how to think visually, and consequently, to build better charts. He applies principles of visual perception and neuroscience to explain why some charts just work, and why some just stress you out. If you are hoping to convey data and ideas in a powerful way, this is a great place to start.
 The Functional Art by Alberto Cairo
Pulling from experience as an information designer and professor of Visual Journalism, Alberto Cairo uses data visualization as a tool to achieve insights into the world around us. In this comprehensive guide, Cairo shows the reader how to use statistical charts, maps, and explanation diagrams, regardless of the kind of data being analyzed. Concepts in this book range from expansive (i.e. the science of how our brains perceive and remember information) to hands-on (i.e. how to use color, type, and other graphic tools to make your information graphics more effective).
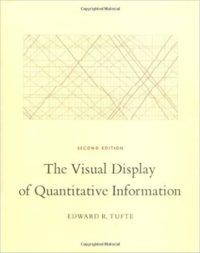
 The Visual Display of Quantitative Information by Edward R. Tufte
In this classic book on statistical graphics, charts, tables, Edward R. Tufte analyzes 250 of the best (and some of the worst) graphics to help the reader visualize how to design high-res displays, edit and improve graphics, detect graphical deception, and more. As said by Tufte himself, “the task of the designer is to give visual access to the subtle and the difficult.” The Visual Display of Quantitative Information teaches us how to do just that.
 Dear Data by Giorgia Lupi and Stefanie Posavec
Different from each book on this list, Dear Data is a collection of postcards written between Lupi and Posavec mapping “the particulars of their daily lives as a series of hand-drawn postcards.” No aspect of their lives is too minute or insignificant to observe and collect data on. From complaints given and received, to the ways they waste time on their phone, to the times and reasons they apologized to someone. Dear Data forces you to look outside the box of the types of data typically collected, showing us no detail is too small to examine.
If you’re just getting started with data analysis, check out our post on 8 of The Best Data Science Books.


